| [1] |
赵春江. 农业遥感研究与应用进展[J]. 农业机械学报, 2014, 45(12):277-293.
|
| [2] |
张勇, 曾玉平, 汪飞星. 中国农产量调查中几种可行的PPS系统抽样设计[J]. 统计与信息论坛, 2005, 20(2):24-30.
|
| [3] |
冯明. 湖北省粮食总产气象预报模型[J]. 华中农业大学学报, 2008, 27(1):144-147.
|
| [4] |
王秀珍. 冬小麦产量农学预报模式[J]. 沙漠与绿洲气象, 1997, 20(6):19-23.
|
| [5] |
LIANG X S, OUYANG J H, LIU Z G, et al. Friction and wear characteristics of BaCr2O4 ceramics at elevated temperatures in sliding against sintered alumina ball[J]. Tribology Letters, 2012, 47(2): 203-209.
|
| [6] |
苟喻. 重庆市水稻估产要素及模型研究[D]. 重庆: 西南大学, 2015.
|
| [7] |
解毅, 王鹏新, 王蕾, 等. 基于作物及遥感同化模型的小麦产量估测[J]. 农业工程学报, 2016, 32(20):179-186.
|
| [8] |
卫炜, 吴文斌, 李正国, 等. 时间序列植被指数重构方法比对研究[J]. 中国农业资源与区划, 2014, 35(1):34-43.
|
| [9] |
刘珊珊, 牛超杰, 边琳, 等. 基于NDVI的水稻产量遥感估测[J]. 江苏农业科学, 2019, 47(3):193-198.
|
| [10] |
肖璐洁, 杨武德, 冯美臣, 等. 基于高光谱植被指数的冬小麦估产模型[J]. 生态学杂志, 2022, 41(7):1433-1 440.
|
| [11] |
李映雪, 谢晓金, 徐德福. 高光谱遥感技术在作物生长监测中的应用研究进展[J]. 麦类作物学报, 2009, 29(1):174-178.
|
| [12] |
崔怀洋, 徐晖, 张伟, 等. 基于高光谱的倒伏冬小麦产量预测模型研究[J]. 麦类作物学报, 2015, 35(8):1155-1 160.
|
| [13] |
张玉萍, 马占鸿. 氮素和小麦条锈病胁迫下小麦高光谱遥感估产模型研究[J]. 中国农学通报, 2014, 30(36):133-140.
|
| [14] |
宋红燕, 胡克林, 彭希. 基于高光谱技术的覆膜旱作水稻植株氮含量及籽粒产量估算[J]. 中国农业大学学报, 2016, 21(8):27-34.
|
| [15] |
谢晓金, 李映雪, 李秉柏, 等. 高温胁迫下水稻产量的高光谱估测研究[J]. 中国水稻科学, 2010, 24(2):196-202.
|
| [16] |
唐延林, 王纪华, 黄敬峰, 等. 利用水稻成熟期冠层高光谱数据进行估产研究[J]. 作物学报, 2004, 30(8):780-785.
|
| [17] |
许童羽, 洪雪, 陈春玲, 等. 基于冠层NDVI数据的北方粳稻产量模型研究[J]. 浙江农业学报, 2016, 28(10):1790-1 795.
|
| [18] |
李明磊, 张晓, 王文辉, 等. 基于高光谱和激光雷达遥感的水稻产量监测研究[J]. 中国农业科学, 2021, 54(14):2965-2 976.
|
| [19] |
秦占飞, 申健, 谢宝妮, 等. 引黄灌区水稻叶面积指数的高光谱估测模型[J]. 武汉大学学报(信息科学版), 2017, 42(8):1159-1 166.
|
| [20] |
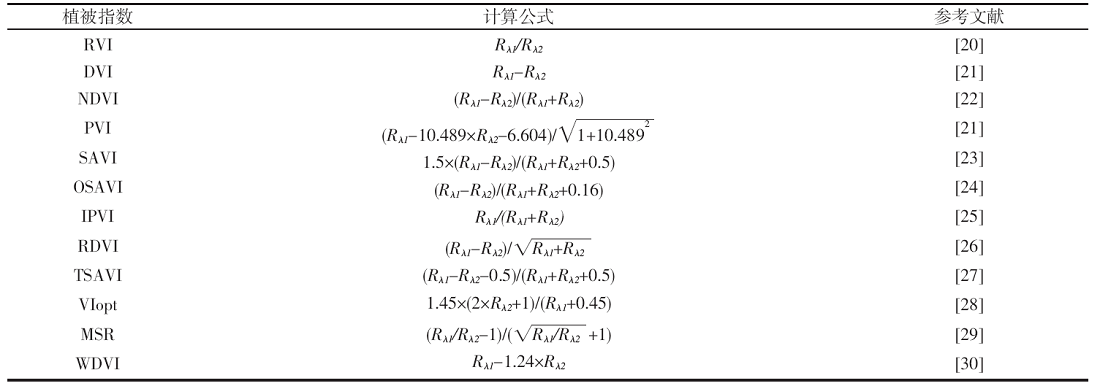
PEARSON R L, MILLER L D. Remote Mapping of Standing Crop Biomass for Estimation of Productivity of the Shortgrass Prairie[C]// Proceedings of the English International Symposium on Remote Sensing of Environment, Fort Collins, Colorado: Colorado University, 1972.
|
| [21] |
RICHARDSON J A, WIEGAND C L. Distinguishing vegetation from soil background information[J]. Photogrammetric Engineering and Remote Sensing, 1977, 43(12): 1 541-1 552.
|
| [22] |
ROUSE J W, HAAS R H, SCHELL J A. Monitoring the vernal advancement and retrogradation (greenwave effect) of natural vegetation[M]. USA: Texas A&M University College Station, 1974.
|
| [23] |
HUETE R A. A soil-adjusted vegetation index(SAVI)[J]. Remote Sensing of Environment, 1988, 25(3): 295-309.
|
| [24] |
RONDEAUX G, STEVEN M, BARET F. Optimization of soil-adjusted vegetation indices[J]. Remote Sensing of Environment, 1996, 55(2): 95-107.
|
| [25] |
ROBERT E C. Calculating the vegetation index faster[J]. Remote Sensing of Environment, 1990, 34(1): 71-73.
|
| [26] |
JEAN-LOUIS R, FRANCOIS-MARIE B. Estimating PAR absorbed by vegetation from bidirectional reflectance measurements[J]. Remote Sensing of Environment, 1995, 51(3): 375-384.
|
| [27] |
BARET F, GUYOT G, MAJOR D J. TSAVI: A vegetation index which minimizes soil brightness effects on LAI and APAR estimation[C]// Proceedings of the 12th Canadian Symposium on Remote Sensing, 1989.
|
| [28] |
YANG H B, LI F, WANG W, et al. Estimating above-ground biomass of potato using random forest and optimized hyperspectral indices[J]. Remote Sensing, 2021, doi: 10.3390/rs13122339.
|
| [29] |
冯浩, 杨祯婷, 陈浩, 等. 基于无人机多光谱影像的夏玉米SPAD估算模型研究[J]. 农业机械学报, 2022, 53(10):211-219.
|
| [30] |
CLEVERS J G P W. Application of a weighted infrared-red vegetation index for estimating leaf area index by correcting for soil moisture[J]. Remote Sensing of Environment, 1989, 9(1): 25-37.
|
| [31] |
田东霞, 曹久才. 基于逐步回归法和BP神经网络模型的苹果产量预测[J]. 现代农业科技, 2022(14):131-133.
|
| [32] |
吴静珠, 王一鸣, 张小超, 等. 近红外光谱分析中定标集样品挑选方法研究[J]. 农业机械学报, 2006, 37(4):80-82.
|
| [33] |
卢艳丽, 胡昊, 白由路, 等. 植被覆盖度对冬小麦冠层光谱的影响及定量化估产研究[J]. 麦类作物学报, 2010, 30(1):96-100.
|
| [34] |
王飞龙, 王福民, 胡景辉, 等. 基于相对光谱变量的无人机遥感水稻估产及产量制图[J]. 遥感技术与应用, 2020, 35(2):458-468.
|
| [35] |
张松, 冯美臣, 杨武德, 等. 基于高光谱植被指数的冬小麦产量监测[J]. 山西农业科学, 2018, 46(4):572-575.
|
| [36] |
ZHOU X, ZHENG H B, XU X Q, et al. Predicting grain yield in rice using multi-temporal vegetation indices from UAV-based multispectral and digital imagery[J]. ISPRS Journal of Photogrammetry and Remote Sensing, 2017, 130: 246-255.
|
| [37] |
周冬琴, 朱艳, 姚霞, 等. 基于水稻冠层光谱特征构建粳型水稻籽粒蛋白质含量预测模型[J]. 作物学报, 2007, 33(8):1219-1 225.
|
| [38] |
张威, 潘剑君, 李勇, 等. 基于冠层光谱特征的冬小麦产量估算研究[J]. 土壤通报, 2015, 46(1):169-176.
|
 ), 许桂玲1,#, 冯跃华1,2,*(